Yunzhou Dashboard
B2B SaaS · Design system and dashboard UI
01Background
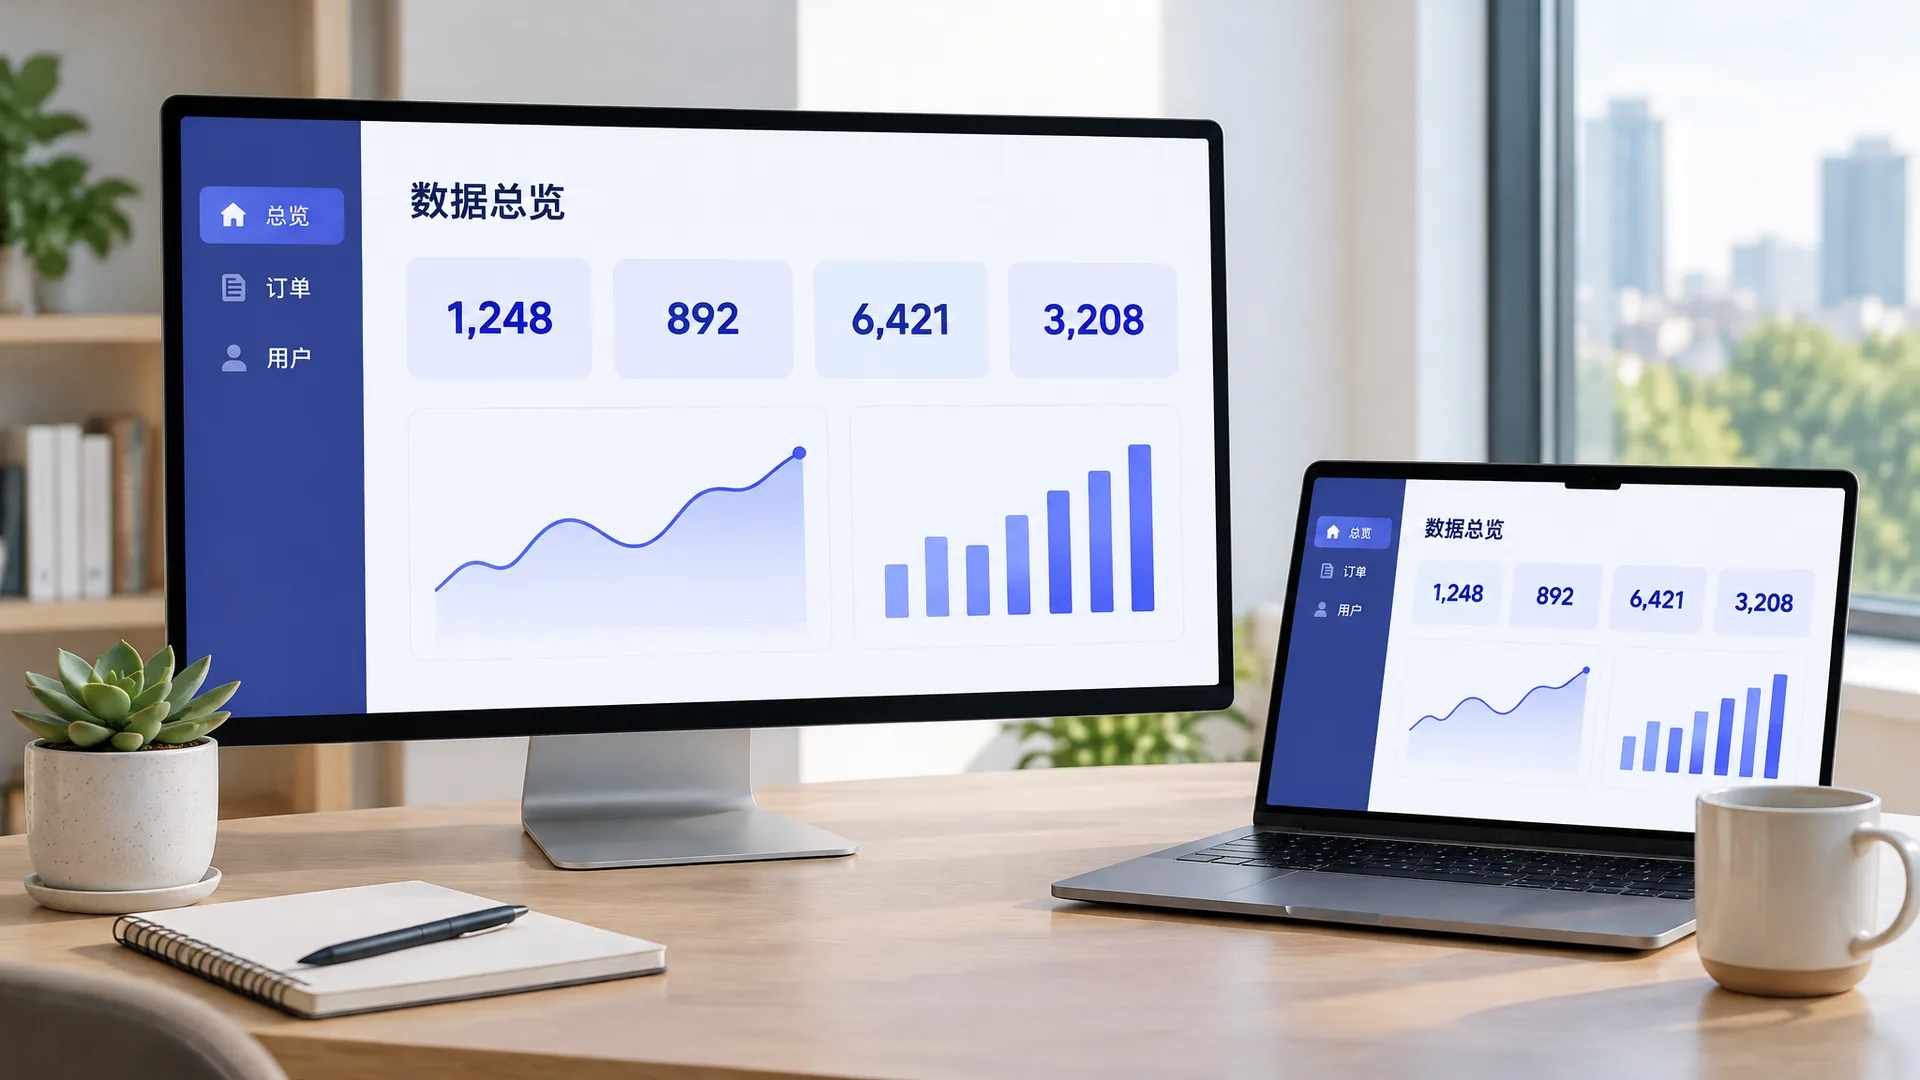
Yunzhou is a SaaS company that does analytics for e-commerce sellers. The product was three years old, and its pages had been built by different people at different times, so buttons, tables and charts each looked different. Customers complained it felt like “three products stitched together.”
02My role
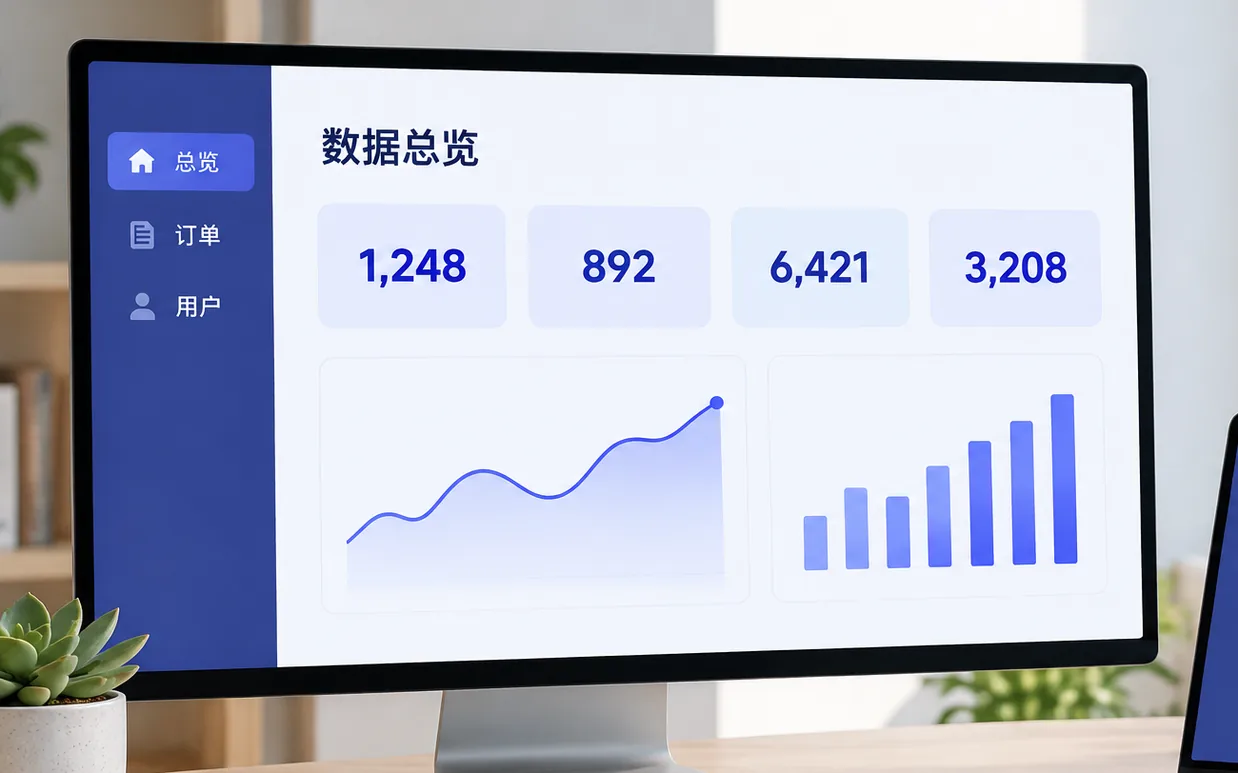
I built the design system (colour, type, components, chart guidelines), redesigned the three core pages (overview, order analysis, user growth), and worked with the front-end team to get the components into the codebase.
03Process
- 1
Audit before touching anything
I screenshotted every existing screen and counted 14 kinds of button and 9 table styles. Then I sat down with product and engineering to decide what stays and what merges.
- 2
Charts get the most attention
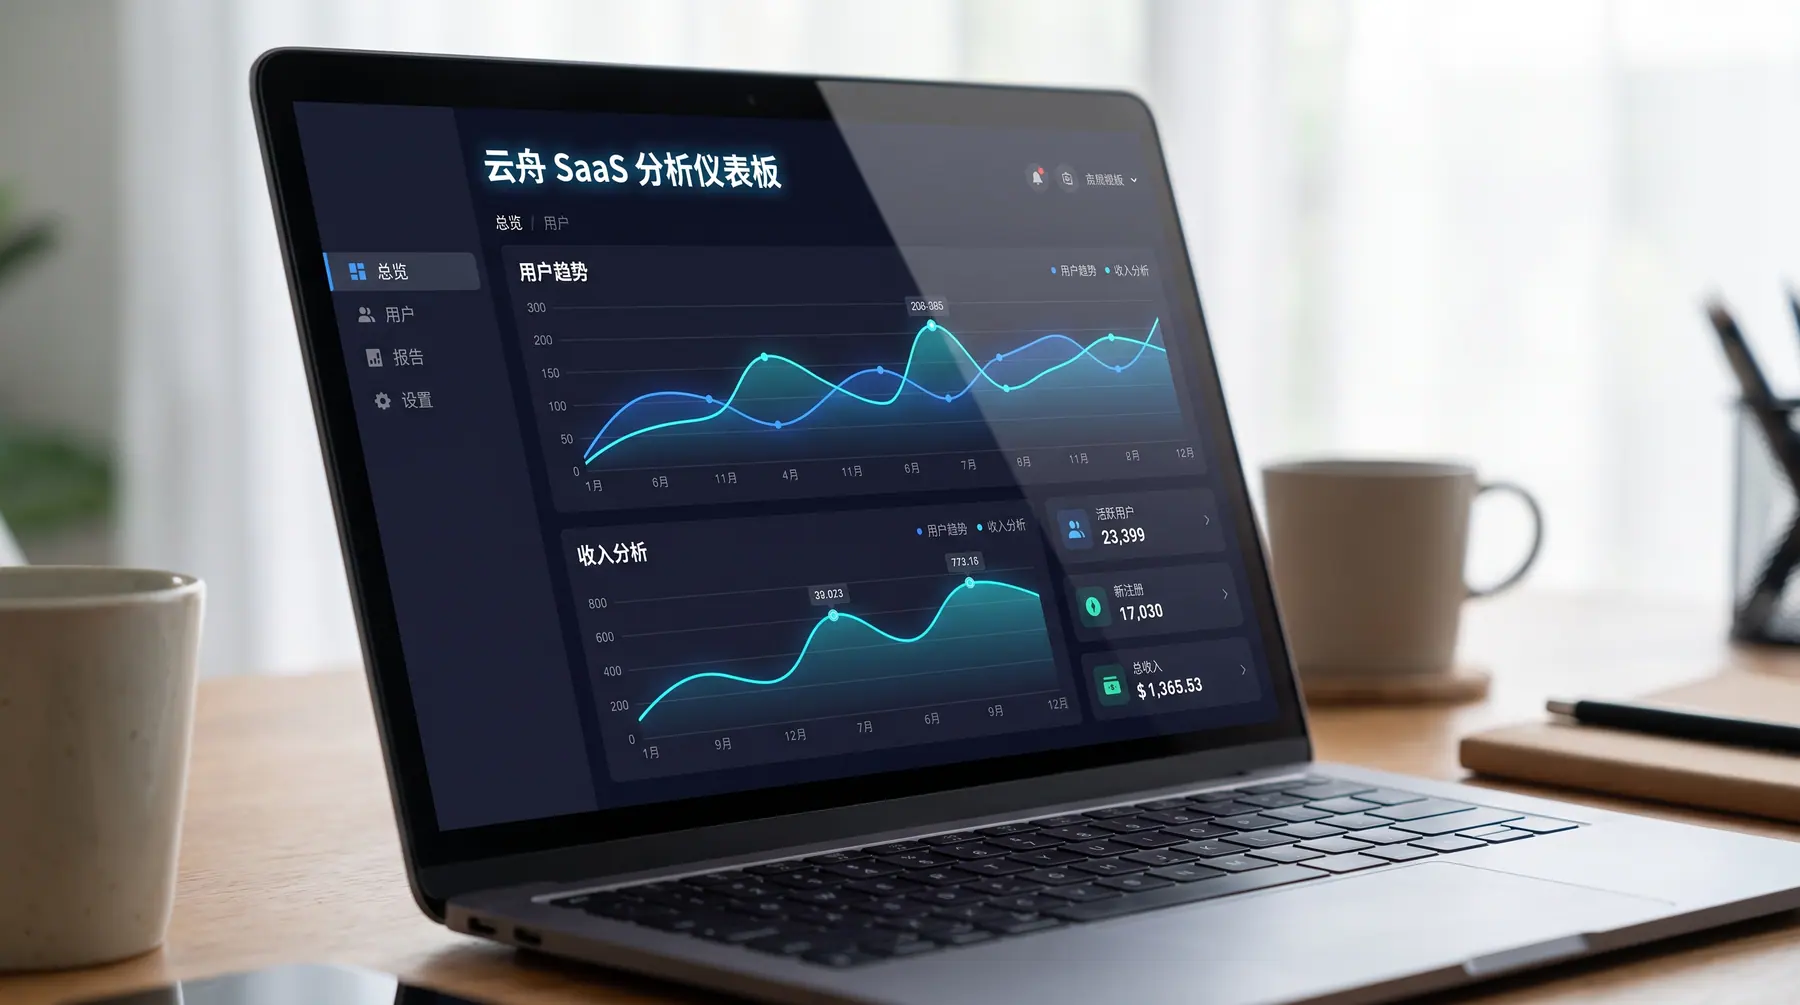
I set a chart palette, axis styles and empty-state rules. Every chart shares one twelve-colour palette, and it is checked for colour-blind safety.
- 3
Components that land in code
Figma variables map one-to-one to design tokens in the codebase, so changing a colour once updates both the design files and the front end.
Palette
- Yunzhou indigo#4B4FBF
- Cyan#2FB5D2
- Midnight#141A2E
- Light grey#F4F5F9
04Result
The new system now covers 90 percent of the product’s pages. Building a new page takes about a third less time, and “ease of use” scored noticeably higher in the next customer satisfaction survey.
- 90%Pages on the new system
- -33%Time to build a new page
- 120+Design components